Background
When talking about scATAC-seq data preprocessing, I guess the first method that most people choose is Cell Ranger ATAC. The 10x Genomics Single Cell ATAC kit is probably the most widely used commercial method for doing scATAC-seq, and Cell Ranger ATAC provides a very convenient way of converting the raw sequencing reads to some sort of count matrix for downstream in-depth analyses. The problems with Cell Ranger ATAC are that:
- It can only handle data from the 10x Genomics kit
- It consumes too much resource and takes too long to run.
Anybody that has used Cell Ranger ATAC should know what I’m talking about. Then Chromap was published. It is a light-weighted and really fast read aligner for single cell ATAC-seq and other chromatin profiling assays. We tried it when it was on bioRxiv, and we immediately started adapting our existing pipelines to use it for almost all chromatin assays. Chromap has an ATAC-seq mode, that is, the --preset atac option. If the ATAC mode is turned on, Chromap will perform all of the following steps automatically for us:
- Trim adapter sequences at the 3’ end of the reads
- Set the maximum insert size between Read 1 & Read 2 to be 2000 bp
- Deduplicate the mapped read pairs at the single-cell level
- Correct cell barcodes based on provided
whitelist - Shift read positions to make the start positions (5’) of the reads represent the actual Tn5 binding sites (not important for downstream peak calling, though)
- Output read pairs (MAPQ >= 30 by default) as the commonly-used
BED-like file fragments.tsv. In addition, theSAMformat is also supported.
Then you can do whatever you want with the output files, which is really convenient and saves us from many preprocessing effort. It is much faster and more flexible than Cell Ranger ATAC. We are using Chromap to do preprocessing for scATAC-seq data obtained from many different methods and platform, i.e. not limited to the 10x scATAC-seq data.
However, what I do like about Cell Ranger ATAC is the per cell level QC information generated during the run, which is really helpful in terms of troubleshooting and getting a rough idea about our data quality. The file I’m talking about is singlecell.csv generated during a run. Using Cell Ranger ATAC v2.0.0 as the example, the file should be located at:
output_prefix/outs/singlecell.csv
Here are the top 10 lines of singlecell.csv from one of our samples:
barcode,total,duplicate,chimeric,unmapped,lowmapq,mitochondrial,nonprimary,passed_filters,is__cell_barcode,excluded_reason,TSS_fragments,DNase_sensitive_region_fragments,enhancer_region_fragments,promoter_region_fragments,on_target_fragments,blacklist_region_fragments,peak_region_fragments,peak_region_cutsites
NO_BARCODE,18682896,5076127,27002,1691108,1137896,20372,1638,10728753,0,0,0,0,0,0,0,0,0,0
AAACGAAAGAAACGCC-1,8,1,0,0,2,0,0,5,0,0,2,0,0,0,2,0,3,6
AAACGAAAGAAAGCAG-1,4,3,0,0,0,0,0,1,0,2,0,0,0,0,0,0,0,0
AAACGAAAGAAAGGGT-1,42,11,0,1,1,3,0,26,0,3,4,0,0,0,4,0,19,36
AAACGAAAGAAATCTG-1,5,3,0,0,0,0,0,2,0,2,1,0,0,0,1,0,0,0
AAACGAAAGAAATGGG-1,3,1,0,0,0,0,0,2,0,0,1,0,0,0,1,0,1,2
AAACGAAAGAACAGGA-1,2,1,0,0,0,0,0,1,0,2,1,0,0,0,1,0,0,0
AAACGAAAGAACCCGA-1,4,3,0,0,0,0,0,1,0,2,0,0,0,0,0,0,0,0
AAACGAAAGAACGCCA-1,2,0,0,0,0,0,0,2,0,2,0,0,0,0,0,0,0,0
You cannot easily get the information at this level of details from other programs. Last year, Chromap v0.2.5 (r473) added the --summary option that can provide similar information that we want. That is really helpful. Having quickly tested the new option, I realised that the numbers are a bit confusing and need some further explanation. For example, it is difficult to know if the numbers are from mutually exclusive categories in the summary. Here I documented how I read those numbers to help me understand the program a bit better. We are using the latest version 0.2.6-r490 at this time of writing.
First, when running Chromap interactively, we see that there are some basic information about the reads printed to the screen. Those things are the standard error during the run. Let’s use the single-cell ATAC data from a mouse cortex that we published previously as an example. Here we capture the standard error into a text file by 2>, and the command that we routinely use is like this:
chromap -t 20 -x ref.idx -r ref.fa \
        --preset atac --summary summary.csv \
        -1 mCortex_ATAC_S1_L001_R1_001.fastq.gz \
        -2 mCortex_ATAC_S1_L001_R2_001.fastq.gz \
        -b mCortex_ATAC_S1_L001_I2_001.fastq.gz \
        --barcode-whitelist 737K-cratac-v1_rc.txt \
        -o chromap_outs/fragments.tsv \
        1> chromap.stdout 2> chromap.stderr \
        && bgzip chromap_outs/fragments.tsv
There are two things we need to investigate:
- We see some common information about the reads in
chromap.stderrandsummary.csv. Are they consistent? - There are still other pieces of QC information missing in the
summary.csvfile, like mapping rate, sequence saturation (or duplications rate), mapping rate, and fraction of reads in peaks (FRiP).
Consistency between stderr and summary
The first problem is relatively easy to figure out. There are some inconsistencies between the quality metrics from chromap.stderr and summary.csv. The numbers in chromap.stderr represent the read number, but the numbers in summary.csv mean fragments, that is, properly mapped read pairs. Here are the lines related to the reads at the end of chromap.stderr :
 1Number of reads: 951163184.
 2Number of mapped reads: 810898762.
 3Number of uniquely mapped reads: 792439756.
 4Number of reads have multi-mappings: 18459006.
 5Number of candidates: 16143953592.
 6Number of mappings: 810898762.
 7Number of uni-mappings: 792439756.
 8Number of multi-mappings: 18459006.
 9Number of barcodes in whitelist: 438281445.
10Number of corrected barcodes: 18669661.
11Sorted, deduped and outputed mappings in 268.81s.
12# uni-mappings: 161581509, # multi-mappings: 6588743, total: 168170252.
13Number of output mappings (passed filters): 158101734
The summary.csv file contains the per-cell level QC information, and here are the top 10 lines of the file:
barcode,total,duplicate,unmapped,lowmapq
CAAAAAAAAAAAAAAA,605,0,605,0
AACCAAAAAAAAAAAA,77,0,77,0
CACTAAAAACAAAAAG,1,0,1,0
TGCAAAAAACAAAAAG,1,0,1,0
ACACAAAAAGAAAACA,1,0,1,0
GGTAAAAAACAAAAAG,1,0,1,0
GAAAAAAAAAAAAAAA,830,0,830,0
CTTAAAAAATAAAACG,1,0,1,0
AAAAAAAACAAAAAGA,3,0,3,0
The information from the two files should be consistent. Now let’s figure out what those numbers mean in each file. If we sum up the reads in each column from summary.csv, we can get:
| Column | Sum |
|---|---|
| total | 475,581,592 |
| duplicate | 230,290,114 |
| unmapped | 70,132,211 |
| lowmapq | 17,057,533 |
Now let’s first check the number of reads in the original fastq files:
$ zcat mCortex_ATAC_S1_L001_R1_001.fastq.gz | wc -l
1902326368
It turns out that we have 475,581,592 (1,902,326,368/4) reads for each R1, R2 and I2. This number is the same as the sum of the column total. Therefore, it is obvious that the numbers in the summary.csv file mean read pairs or fragments. The numbers in the chromap.stderr file mean reads. With that in mind, let’s use the numbers in summary.csv to reproduce the numbers in chromap.stderr.
The first line is:
Number of reads: 951163184.
which is basically total * 2:
475,581,592 $\times$ 2 = 951,163,184
We can look at the 2nd, the 3rd and the 4th lines at the same time:
Number of mapped reads: 810898762.
Number of uniquely mapped reads: 792439756.
Number of reads have multi-mappings: 18459006.
We noticed that “Number of mapped reads” is the sum of “Number of uniquely mapped reads” and “Number of reads have multi-mappings”:
810,898,762 = 792,439,756 + 18,459,006
The “Number of mapped reads” is consistent with the summary.csv file, which is (total - unmapped) * 2:
(475,581,592 - 70,132,211) $\times$ 2 = 810,898,762
Then the numbers of uniquely mapped and multi-mapping reads are 792,439,756 and 18,459,006, respectively. Since we know that mapping uniqueness is related to MAPQ, multi-mapping reads should have low MAPQ. Based on this logic, we should expect “Number of uniquely mapped reads” to be (total - unmapped - lowmapq) * 2 and “Number of reads have multi-mappings” to be lowmapq * 2. However, it turns out:
(475,581,592 - 70,132,211 - 17,057,533) $\times$ 2 = 776,783,696 < 792,439,756
17,057,533 $\times$ 2 = 34,115,066 > 18,459,006
Now we realised that Chromap has a -q flag to control the minimum MAPQ to send to the output. The default is -q 30, meaning any read with MAPQ < 30 is considered to be lowmapq. However, I guess the definitions of “uniquely mapped reads” and “multi-mapped reads” are MAPQ > 0 and MAPQ = 0, respectively. Under the current setting, we have some “uniquely mapped reads” in the lowmapq category.
Is this the case? We re-ran the program with the -q 1 flag and redirect the standard error and summary to q1_chromap.stderr and q1_summary.csv, respectively. In this case, the q1_chromap.stderr remain almost unchanged, except the last line:
 1Number of reads: 951163184.
 2Number of mapped reads: 810898762.
 3Number of uniquely mapped reads: 792439756.
 4Number of reads have multi-mappings: 18459006.
 5Number of candidates: 16143953592.
 6Number of mappings: 810898762.
 7Number of uni-mappings: 792439756.
 8Number of multi-mappings: 18459006.
 9Number of barcodes in whitelist: 438281445.
10Number of corrected barcodes: 18669661.
11Sorted, deduped and outputed mappings in 268.81s.
12# uni-mappings: 161581509, # multi-mappings: 6588743, total: 168170252.
13Number of output mappings (passed filters): 161219326
which makes sense, since -q only changes the the filtering standards, NOT the behaviour of the program.
The column sums from the q1_summary.csv are:
| Column | Sum |
|---|---|
| total | 475,581,592 |
| duplicate | 234,736,148 |
| unmapped | 70,132,211 |
| lowmapq | 9,493,907 |
Due to the -q 1 flag, the lowmapq column is basically the number of reads with a MAPQ of 0. Now let’s do a similar calculations of (total - unmapped - lowmapq) * 2 and lowmapq * 2, and we compared them to “Number of uniquely mapped reads” and “Number of reads have multi-mappings”, respectively:
(475,581,592 - 70,132,211 - 17,057,533) $\times$ 2 = 791,910,948 < 792,439,756
94,93,907 $\times$ 2 = 18,987,814 > 18,459,006
The numbers are still not the same, but they are close. There are 18,987,814 - 18,459,006 = 528,808 more reads in the q1_summary.csv file compared to q1_chromap.stderr, and 792,439,756 - 791,910,948 = 528,808 fewer reads in the q1_summary.csv file compared to q1_chromap.csv. It seems these 528,808 reads have MAPQ of 0s, but they are considered to be uniquely mapped reads. I asked the question in their GitHub repo (issue #167). Thank Li Song for the explanation, now we understand that reads that are uniquely but poorly mapped to the genome are still considered as uniquely mapped but will be assigned a MAPQ of 0. That explains the discrepancies.
Now let’s continue with q1_chromap.stderr. Lines 5-11 are straightforward, but we need to take extra care of of lines 9-10:
Number of barcodes in whitelist: 438281445.
Number of corrected barcodes: 18669661.
The sum of the total column from q1_summary.csv is 475,581,592, which is much higher than 438,281,445 + 18,669,661. Then we realised that there were 5,090,766 lines of record in the q1_summary.csv file:
$ wc -l q1_summary.csv
5090766 q1_summary.csv
meaning there are 5,090,765 barcodes there, but we only have 737,280 barcodes in the whitelist 737K-cratac-v1_rc.txt. It seems that barcodes that are not in the whitelist are also included in the summary. Let’s figure out how many reads are there from barcodes in the whitelist and see if they are consistent with the q1_chromap.stderr file. This can be achieved by:
join -t "," -1 1 -2 1 \
    <(sort 737K-cratac-v1_rc.txt) \
    <(sed -n '2,$ p' q1_summary.csv | sort -t "," -k1,1) \
    > q1_summary_in_whitelist.csv
The sum of the column total from q1_summary_in_whitelist.csv is 456,955,085, which is so close but not the same to 438,281,445 + 18,669,661 = 456,951,106. It turns out that it is caused by a known bug of treating ‘N’ in the barcode reads as ‘A’, and will be solved in the future.
The last two lines (lines 12 & 13) are the numbers after deduplications, and they are the fragment numbers, which is a bit confusing, since all previous numbers are read numbers. Anyway, the last line says:
Number of output mappings (passed filters): 161219326
which is consistent with the number of lines in the fragment.tsv file:
$ wc -l fragments.tsv
161219326 fragments.tsv
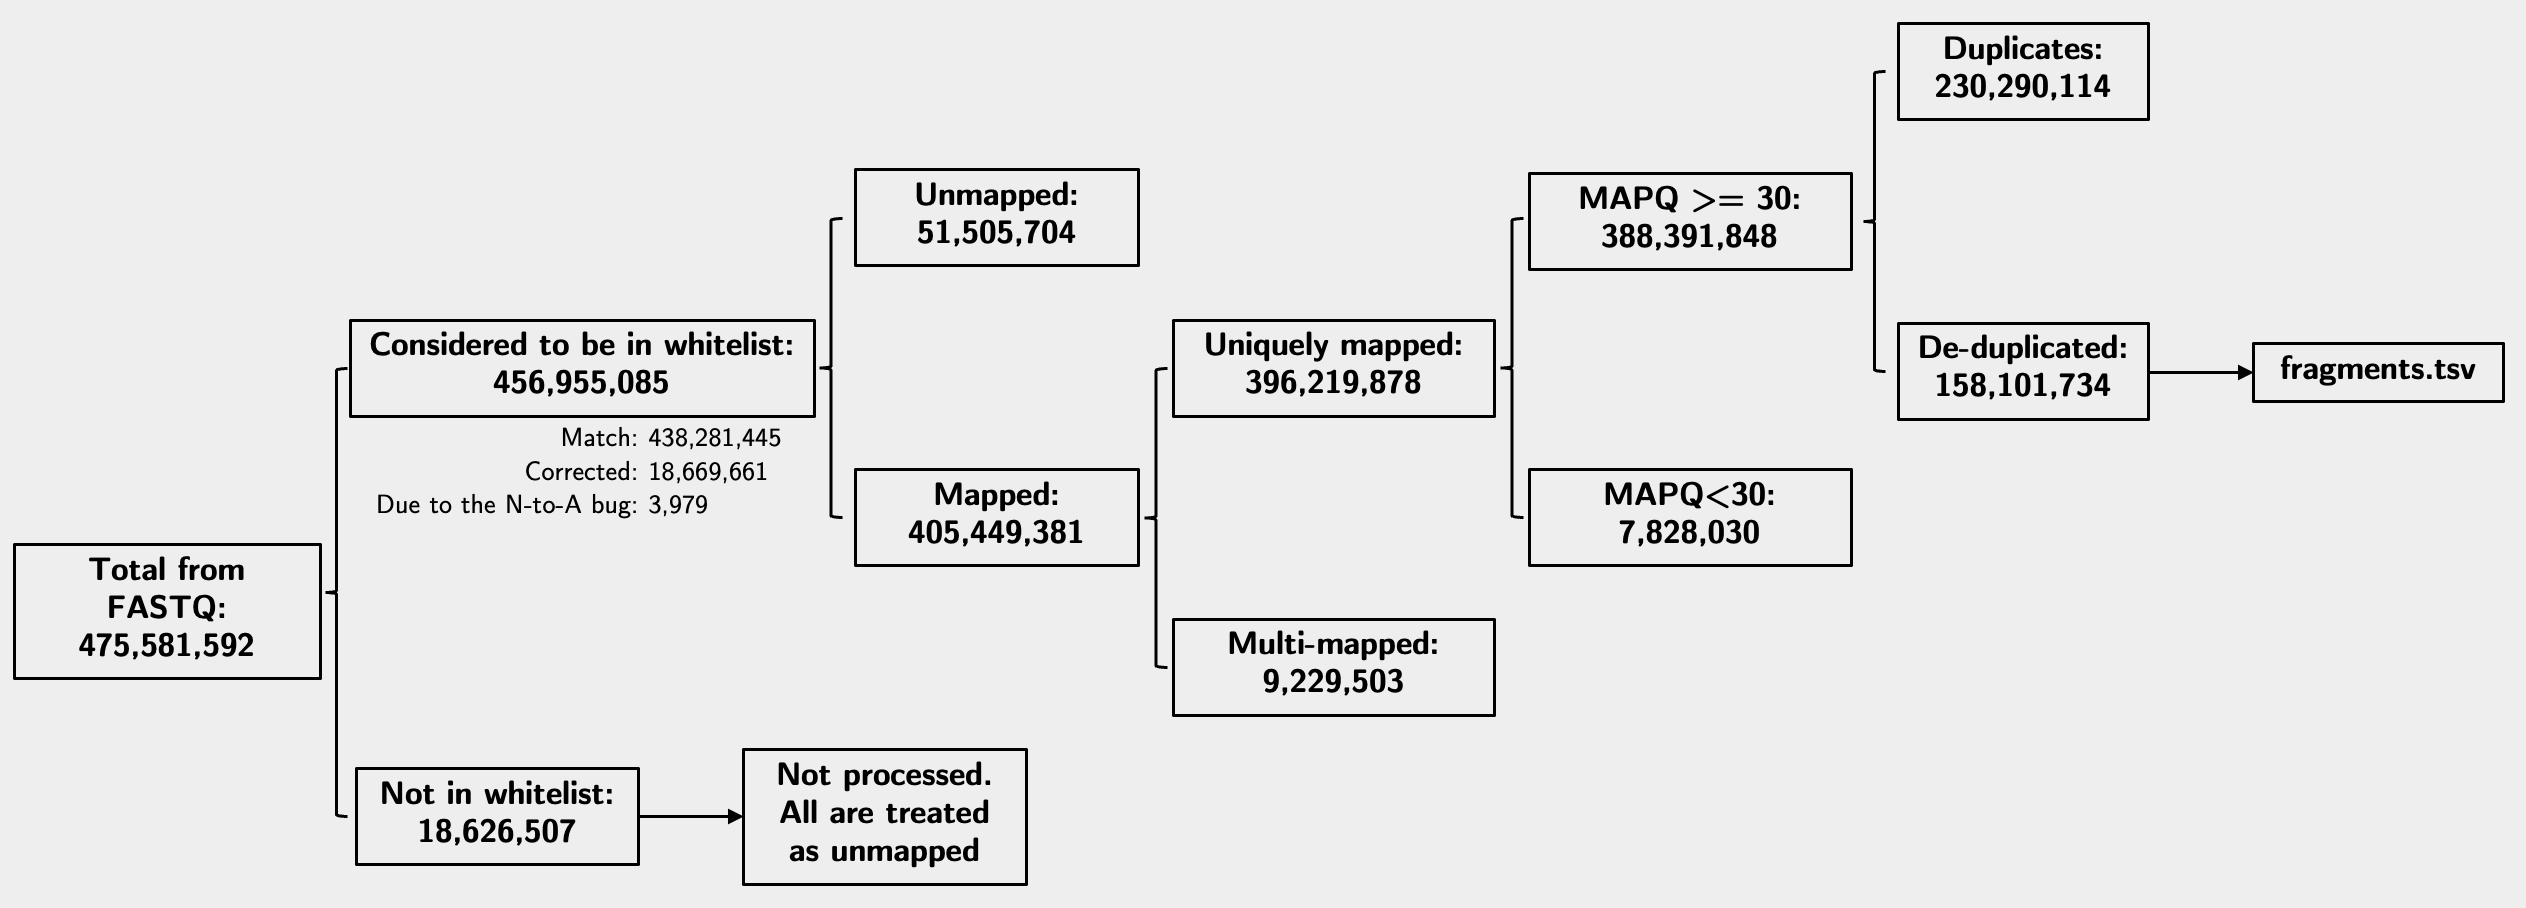
With all the above information, I can finally put all numbers together in the diagram below from my original run with the default -q 30 setting. Note the numbers indicate fragment numbers, or read pairs:
Other QC metrics
The second problem is that the summary.csv file does not contain all information that we want, such as the mapping rate, duplication rate, the number of unique fragments etc. Therefore we need to figure out by ourselves. I think the mapping rate, the duplication rate and the number of total unique fragments (nuclear + chrM) are straightforward to calculate. Before we proceed, let’s again do some sanity check.
To this end, let’s use the cell CTCGGATCTTACGTTG as an example. First, we check its basic information in the summary.csv file:
$ grep CTCGGATCTTACGTTG summary.csv
CTCGGATCTTACGTTG,151143,87981,16097,4993
meaning it has a total of 151,143 fragments, of which 87,981 are duplicates, 16,097 are unmapped, and 4,993 have a MAPQ less than 30. What does it say in the fragments.tsv file? Let’s check a few things.
$ grep CTCGGATCTTACGTTG fragments.tsv | addCols stdin
0.00 2996956460198.00 2996966152396.00   0.00 130053.00

$ grep CTCGGATCTTACGTTG fragments.tsv | wc -l
42072
The addCols program is a convenient binary from UCSC utilities that computes the sum of each column of a file or from standard input (stdin). In this case, the fifth column of the fragments.tsv file is the number of fragments at a particular position. The sum of them should be the total number of mapped fragments that passed filters in that cell, which is 130,053. This is equal to total - unmapped - lowmapq:
151,143 - 16,097 - 4,993 = 130,053
which is consistent with the summary. Good! The number of lines of the cell is 42,072, which should be the total number of fragments in that cell after deduplication. It is equal to total - unmapped - lowmapq - duplicate:
151,143 - 16,097 - 4,993 - 87,981 = 42,072
which is consistent with the summary. Again, good!
Now that we figure out the source of the numbers, we could compute some missing QC metrics. We can compute the following simply using the information from the summary.csv file:
Overall alignment (mapping) rate: (total - unmapped)/total
Total unique fragments: total - duplicate - unmapped - lowmapq
Duplication rate (saturation): duplicate/(total - unmapped - lowmapq)
Of course, other QC metrics like chrM%, FRiP and TSS enrichment score are also important. They are slightly more difficult to get at this stage and I will write a new post to cover that1.