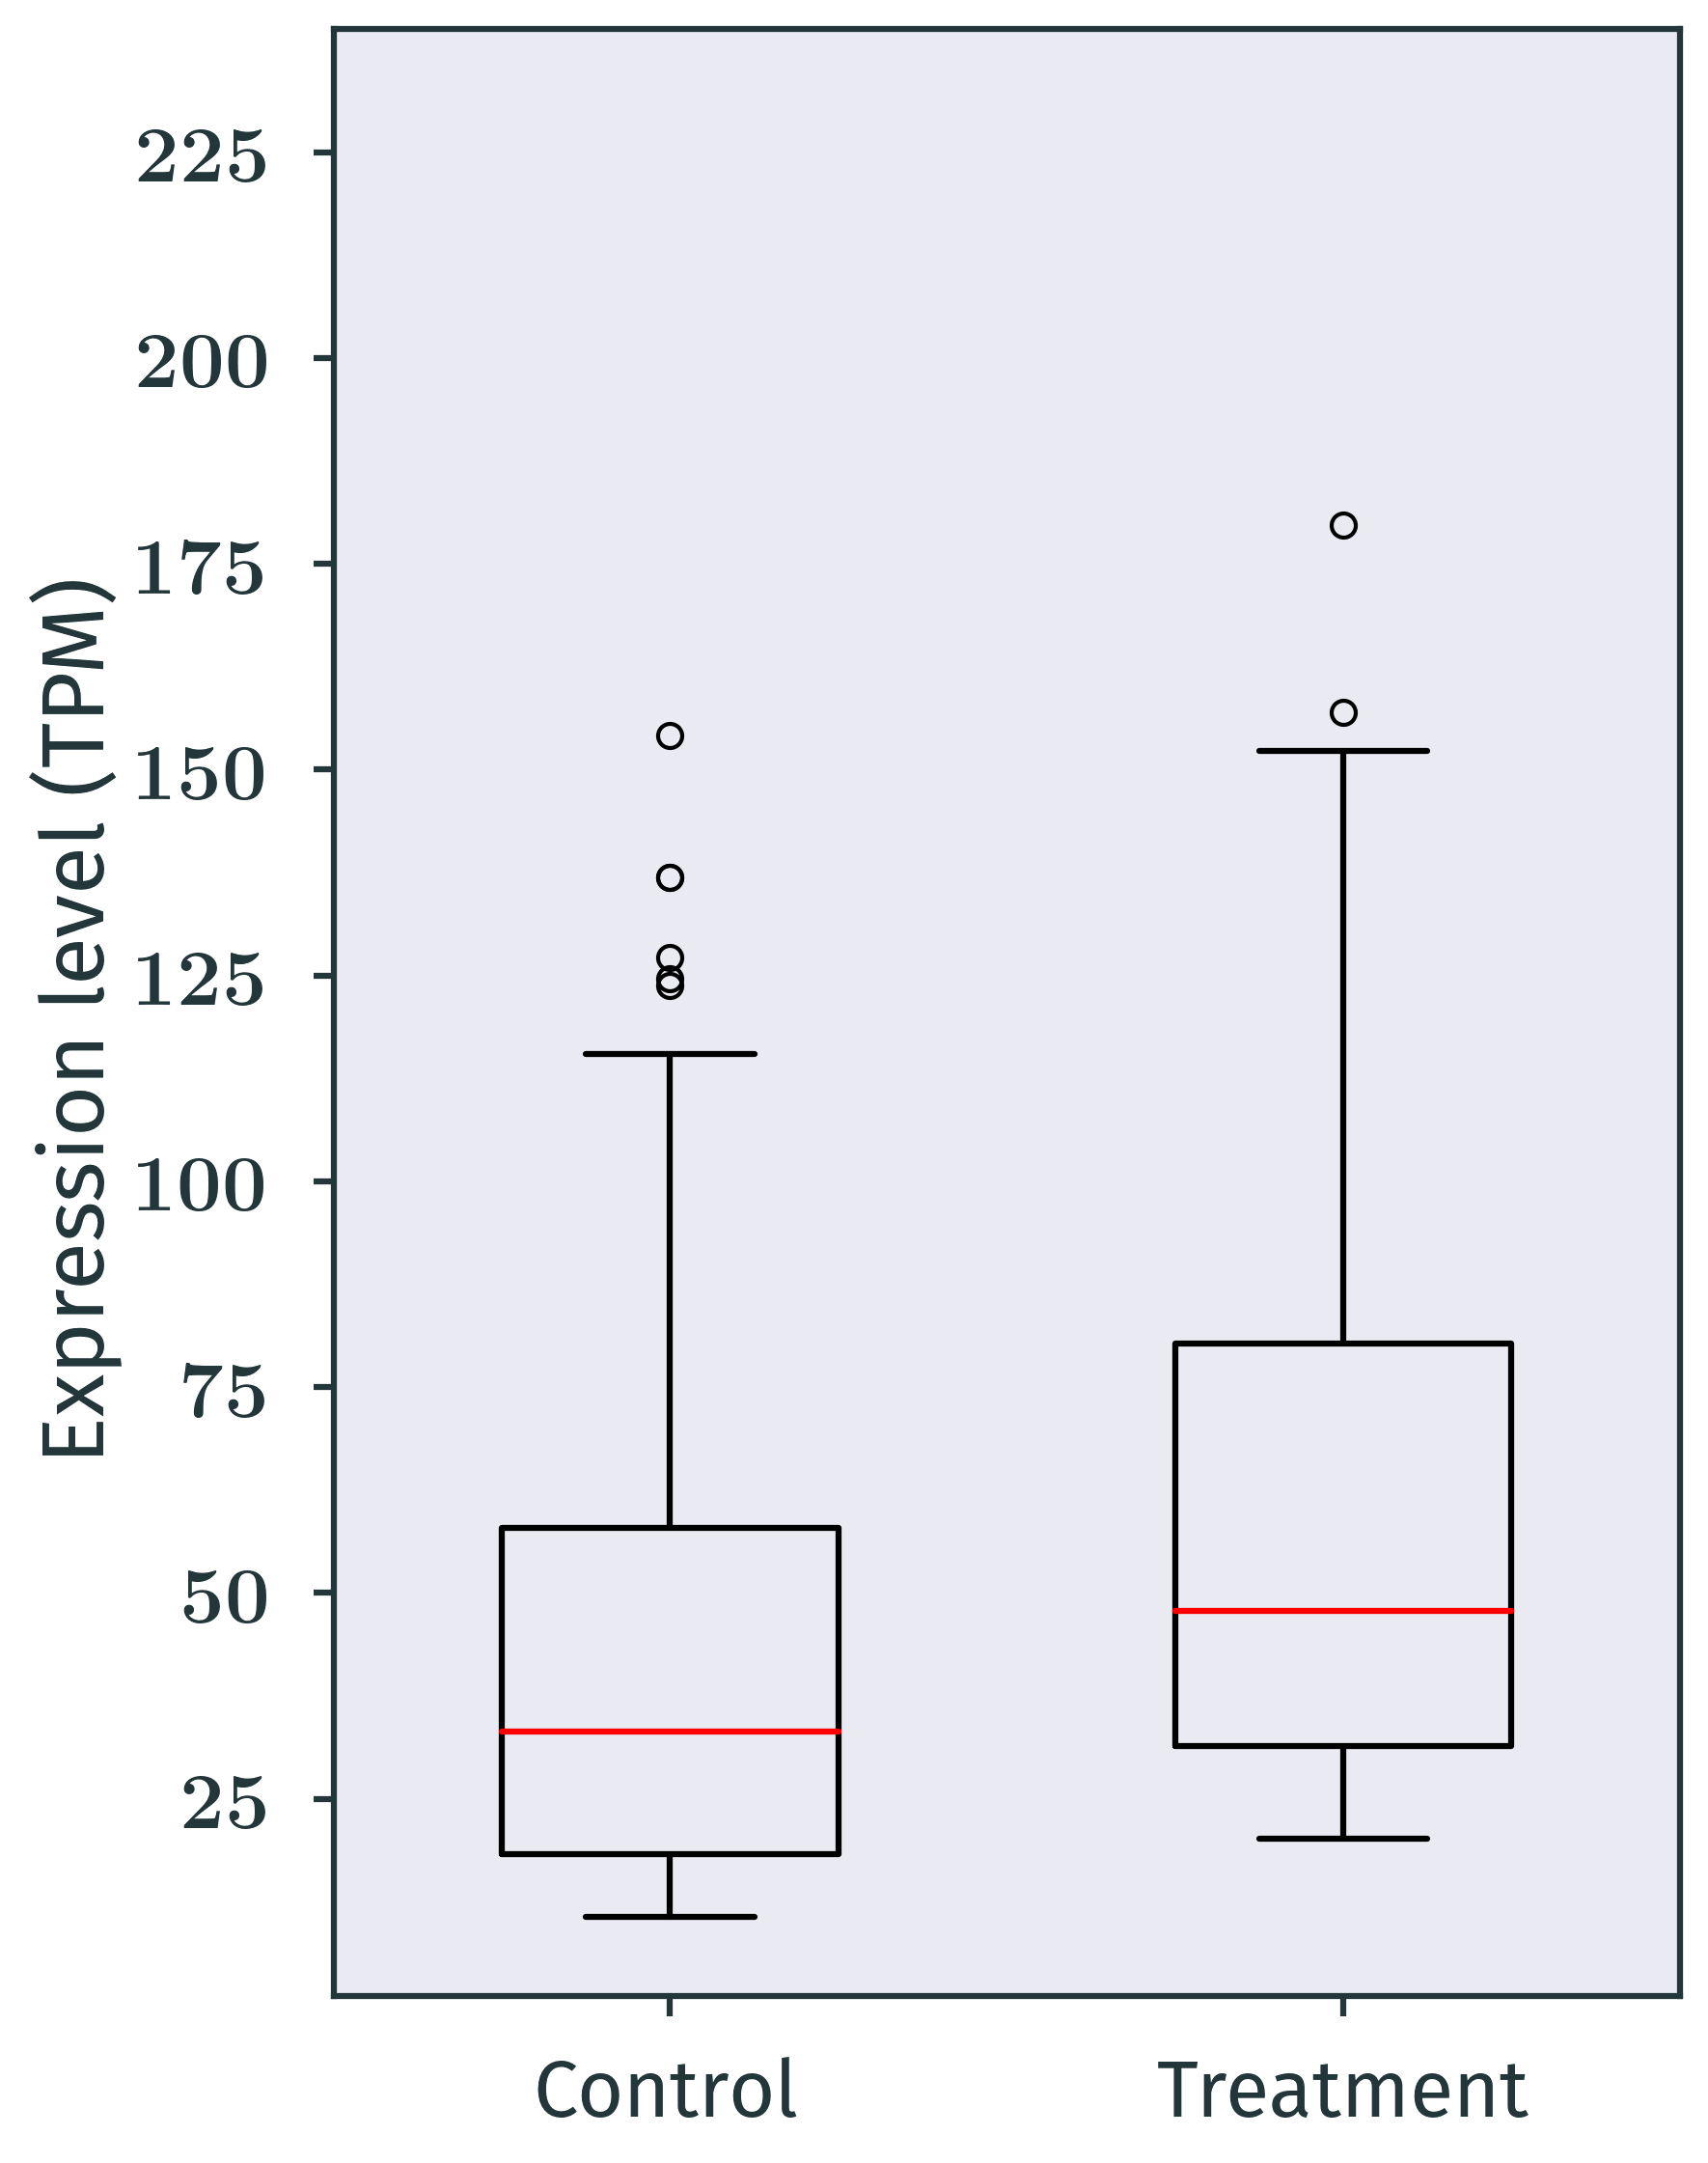
Ever since I came across the metropolis theme of Beamer two years ago, I always used that theme to prepare presentation and lecture slides whenever possible. I really like the design. The style is hard to resist. One problem with it or with beamer in general is that plotting is difficult and limited. I know that pgfplots is very powerful, and you can do some pretty complicated plots with it. I used it for routine basic plotting in Beamer, such as the box/scatter plot, the bar chart, the histogram. However, I’m not very proficient at it. For some plots with really large data files, it is better just use matplotlib. However, when I do that, I have another problem shown below:
The style of the plots are not consistent with the general theme. I set my Beamer background colour to be #FEFBF1, which makes my eyes feel comfortable. The white background of the image from matplotlib is not good in this case. This is a easy fix. I could just set mpl.rcParams['figure.facecolor'] = 'none', which makes the figure have transparent background at the same time preservses the axes grey colour. However, the style still does not fit due to the typeface and other small things. Then I found a very nice post from Jack. It seems I’m not the only person who want a metropolis style for matplotlib. Anyway, the solution from that post is to use the LaTeX package FiraSans and put your preamble into mpl.rcParams['text.latex.preamble']. Using the metropolis.mplstyle from the post, I’m one step closer to what I want.
The first problem is that matplotlib gives errors when using the metropolis.mplstyle. It turns out I need to remove the comma in the text.latex.preamble, like this:
text.latex.preamble: \usepackage[T1]{fontenc} \usepackage[lf]{FiraSans} \usepackage{sfmath}
The output:
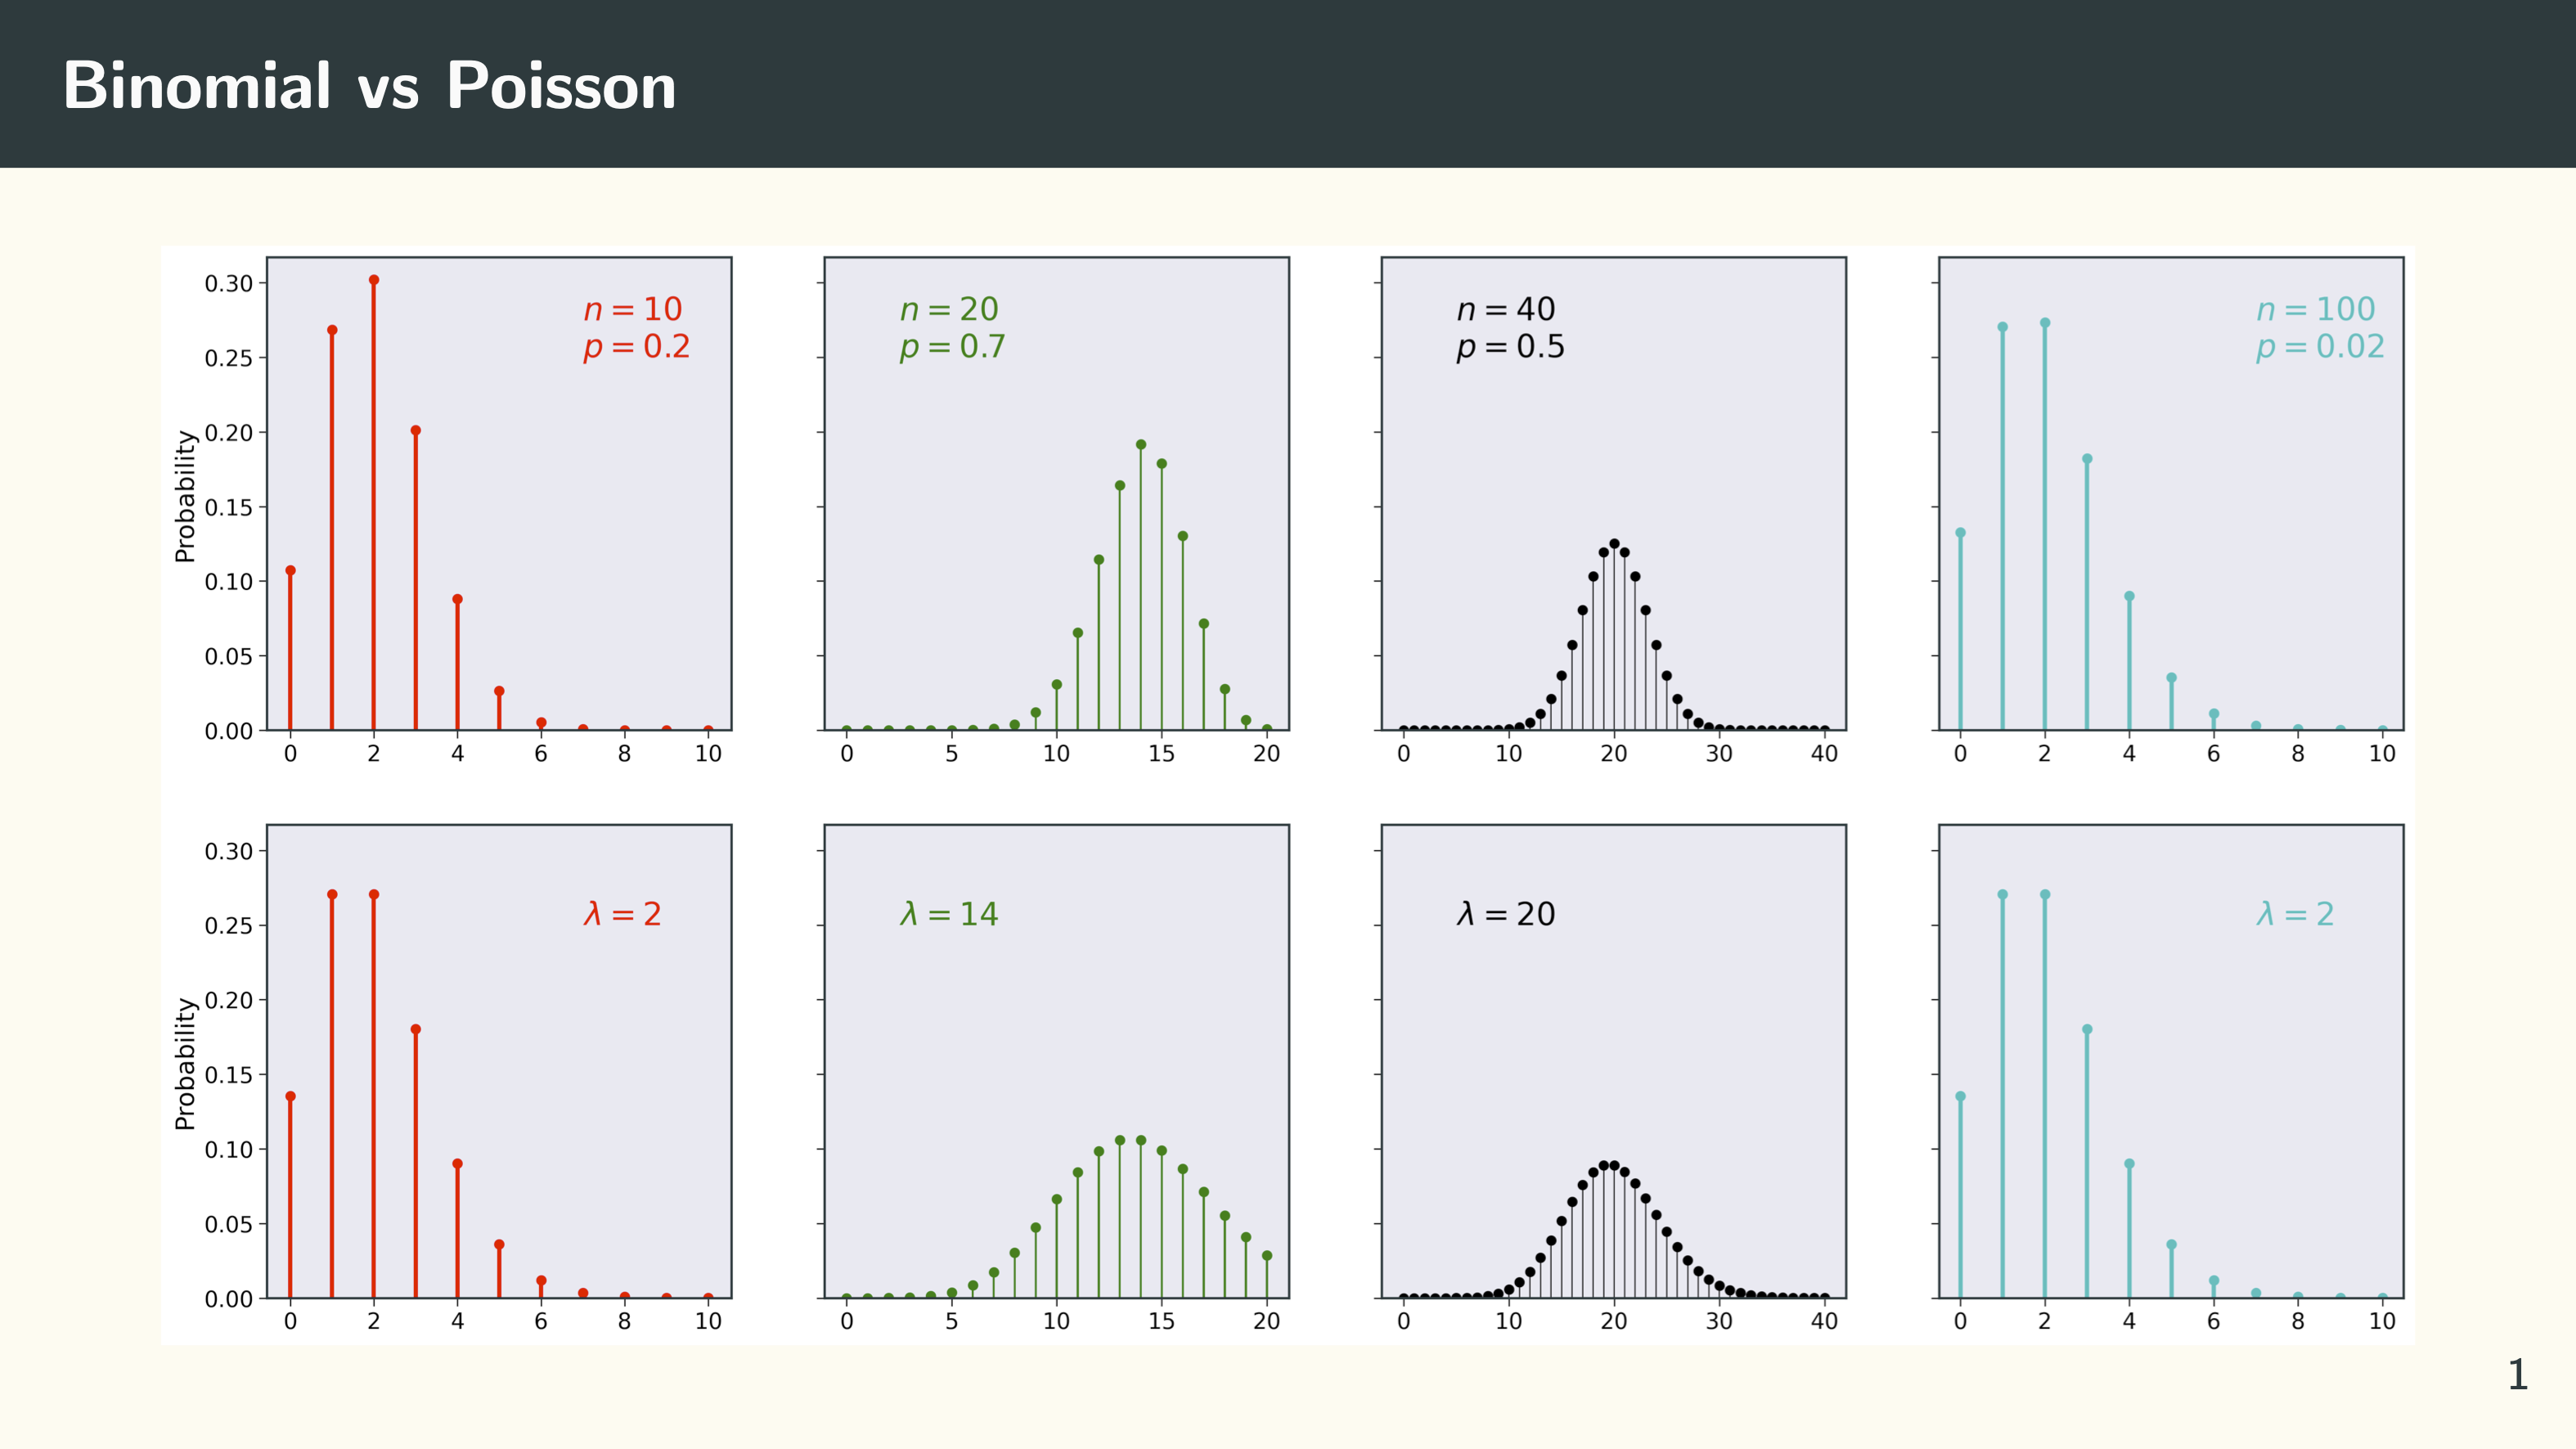
Looks much better but still not exactly what I want. My problem is the default math font in the metropolis theme, which is in a sans-serif style, that produces letters and numbers like shown above. This is what x and y look like in another plot if I just use the default metropolis theme:
What I really want is the original latex math font, the Latin Modern Math, that displays x and y as $x$ and $y$. In Beamer, I use \usefonttheme[onlymath]{serif} to solve the problem, but it resulted in an error when putting that into mpl.rcParams['text.latex.preamble']. I’m not very proficient in latex, so it is difficult for me to debug. After fiddling around a bit, the solution is as simple as removing \usepackage{sfmath} 😂!
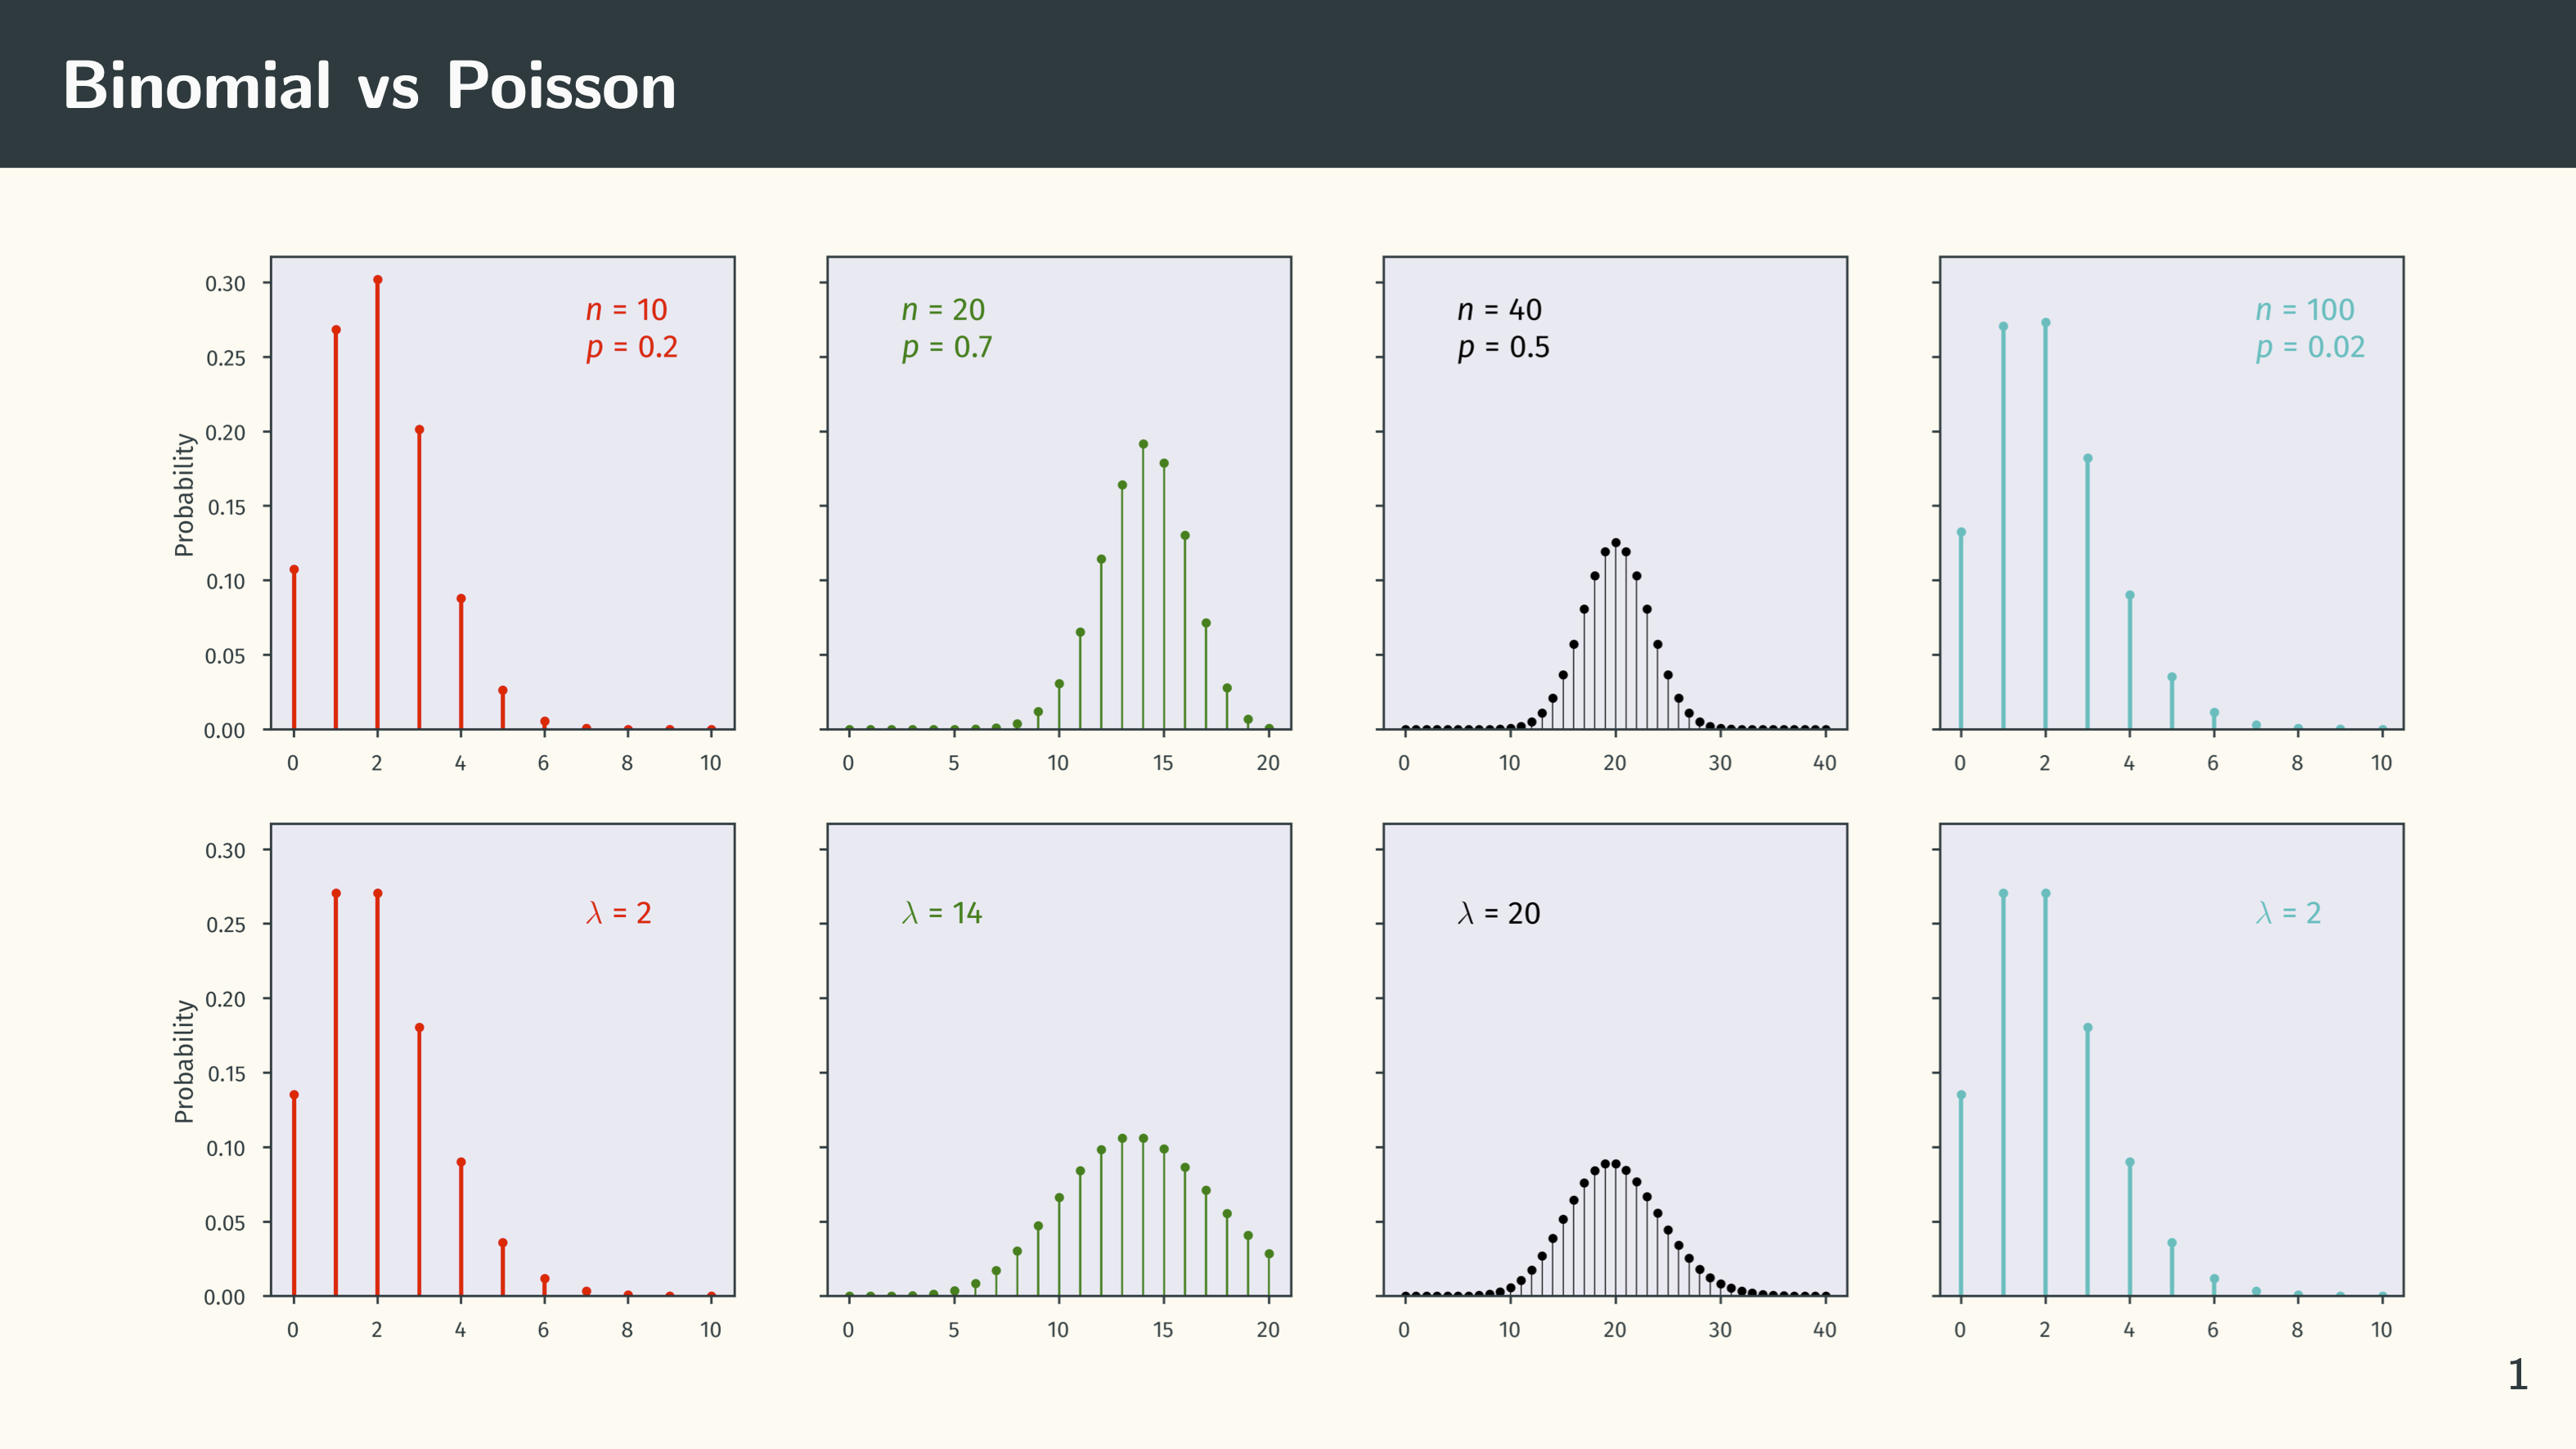
Now I almost got what I want. Once the usepackage{sfmath} is removed, this is what the slide looks like:

One last problem is the strokes of the generated math writing from matplotlib are too thin. It is good for regular reading, but for presentation, bold fonts would be great. One solution is that I could use the amsmath package and use the \boldsymbol that comes with it to control the font weight. I’m pretty sure I want all of them to be bold, so a simpler solution is to just use \boldmath in mpl.rcParams['text.latex.preamble'].
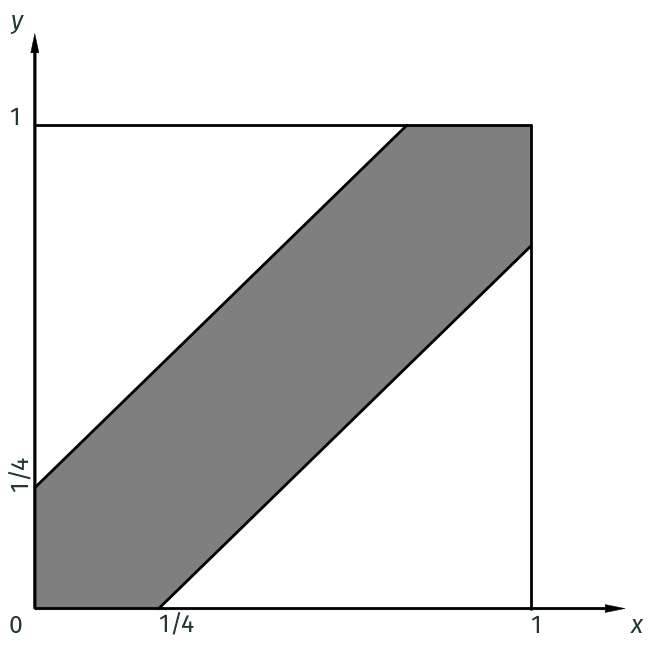
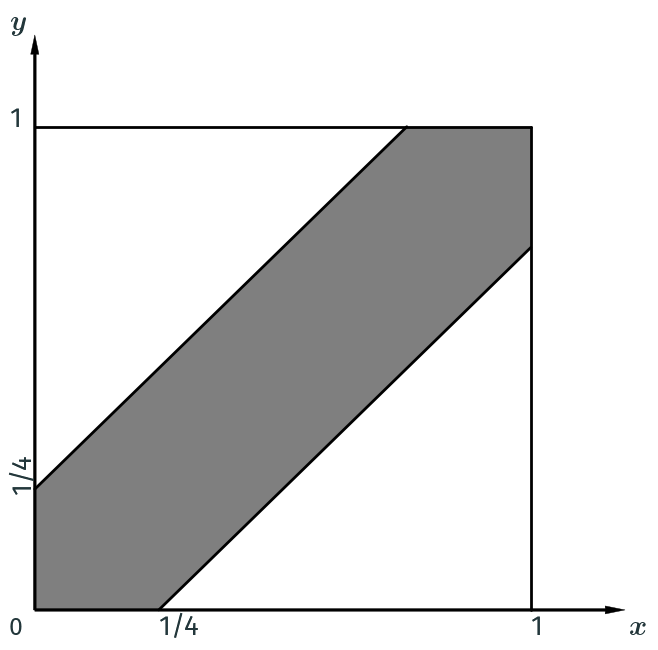
The final look is like this:

Other plots are like this:
Eventually, here is the metropolis.mplstyle that works for me:
# Matplotlib style file to create plots that integrate nicely
# with the metropolis beamer template

# Colours pulled from beamermetropolis.sty
# Background colour in beamermetropolis.sty is as black!2
# not very useful for matplotlib. Approximate as FAFAFA

axes.axisbelow: True
axes.edgecolor: 23373B
axes.facecolor: EAEAF2
axes.grid: False
axes.labelcolor: 23373B
axes.labelsize: 22
axes.linewidth: 1.5

# Set up colour cycle from metropolis
axes.prop_cycle: cycler('color', ['4C72B0', 'EB811B', '14B03D', '604c38'])

# Default size of single figure spanning textwidth of thesis
figure.figsize: 4.2519699737097, 2.627861962896592
figure.titlesize: 22
figure.facecolor: none

figure.dpi: 100

font.family: sans-serif
font.size: 20

grid.color: white
grid.linestyle: -
grid.linewidth: 1

image.cmap: Greys

legend.fontsize: 18
legend.frameon: False
legend.numpoints: 1
legend.scatterpoints: 1

lines.antialiased: True
lines.linewidth: 1.25
lines.markeredgewidth: 0
lines.markersize: 7
lines.solid_capstyle: round

patch.facecolor: 4C72B0
patch.linewidth: .3

savefig.facecolor: none
savefig.format: pdf

text.usetex: True
text.latex.preamble: \usepackage[T1]{fontenc} \usepackage[lf]{FiraSans} \boldmath
text.color: 23373B

xtick.color: 23373B
xtick.labelsize: 20
xtick.direction: out
xtick.major.pad: 10
xtick.major.size: 5
xtick.major.width: 1.5
xtick.minor.size: 0
xtick.minor.width: .5

ytick.color: 23373B
ytick.labelsize: 20
ytick.direction: out
ytick.major.pad: 10
ytick.major.size: 5
ytick.major.width: 1.5
ytick.minor.size: 0
ytick.minor.width: .5